Period
When you load a return series file or previous Estimator case, the Period Table on the Historical Worksheet populates according to the dates contained in the file. The Period field beneath the columns displays the number of possible observations, missing or observed, in the period used by the return series. Whether the frequency of the historical dataset is daily, monthly, quarterly, or annual, the Estimator produces annual estimates by annualizing return series according to a standard approximation: monthly returns multiplied by 12 and standard deviations multiplied by the square root of 12. Other frequencies are handled similarly.
Drop down menus beneath the From and To column headings on the Historical Worksheet display the beginning and ending dates for the estimation problem. These columns populate automatically with the first date that appears in each asset's return series. When return series start on different dates, the Period Field calculates from the oldest return observation, and the more recent dates appear in red. Similarly, when return series end on different dates, the Period Field calculates to the most recent observation, and the older dates appear in red. The Missing Data field on the Results Worksheet reads "Missing Data" when any missing data appears within the date range specified in the From and To columns.
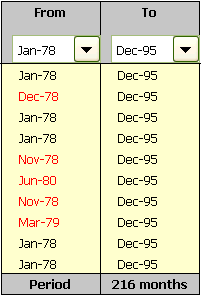
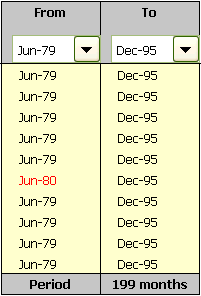
Table 1 Table 2


In Table 1, several of the assets have returns stretching back to January of 1978. The red dates indicate the earliest return observation for the remaining assets. The Estimator calculates the period from January of 1978. As you change the date in the From drop down menu, the dates and period change to reflect the newly selected date. Table 2 shows the same assets, but with the From date adjusted to June of 1979. Now all but one of the assets have observations, and the period is reduced to 199 months.
Longer return series provide more statistical reliability, as long as the entire period is relevant to the intended investment period for the model portfolios to be generated by the Optimizer. Ideally, include several investment cycles for each asset. Bear in mind that though the Missing Data Algorithm produces estimates in the presence of missing observations, its accuracy diminishes with larger percentages of incomplete data, particularly when the data is in sequence. Examine your data to determine what period adjustments meet your needs and make sure there is enough relevant information in the dataset to produce adequately precise estimates.
Related Topics: